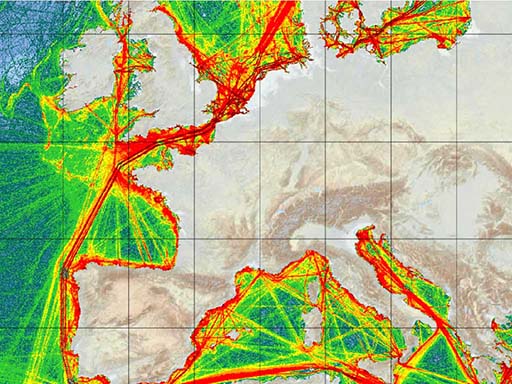
Traffic density maps
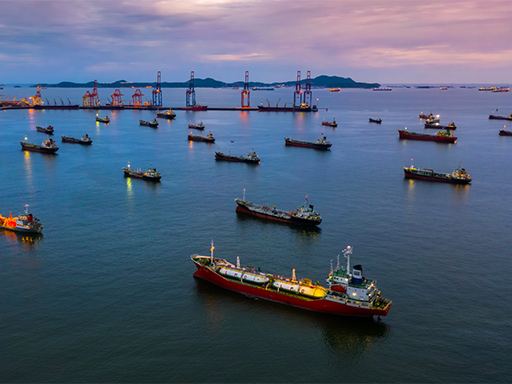
The EU’s waters are among the busiest in the world, with thousands of ship journeys made every day. As a result, Member State authorities need reliable statistics on vessel movement patterns, giving them accurate information in a way that meets their needs.
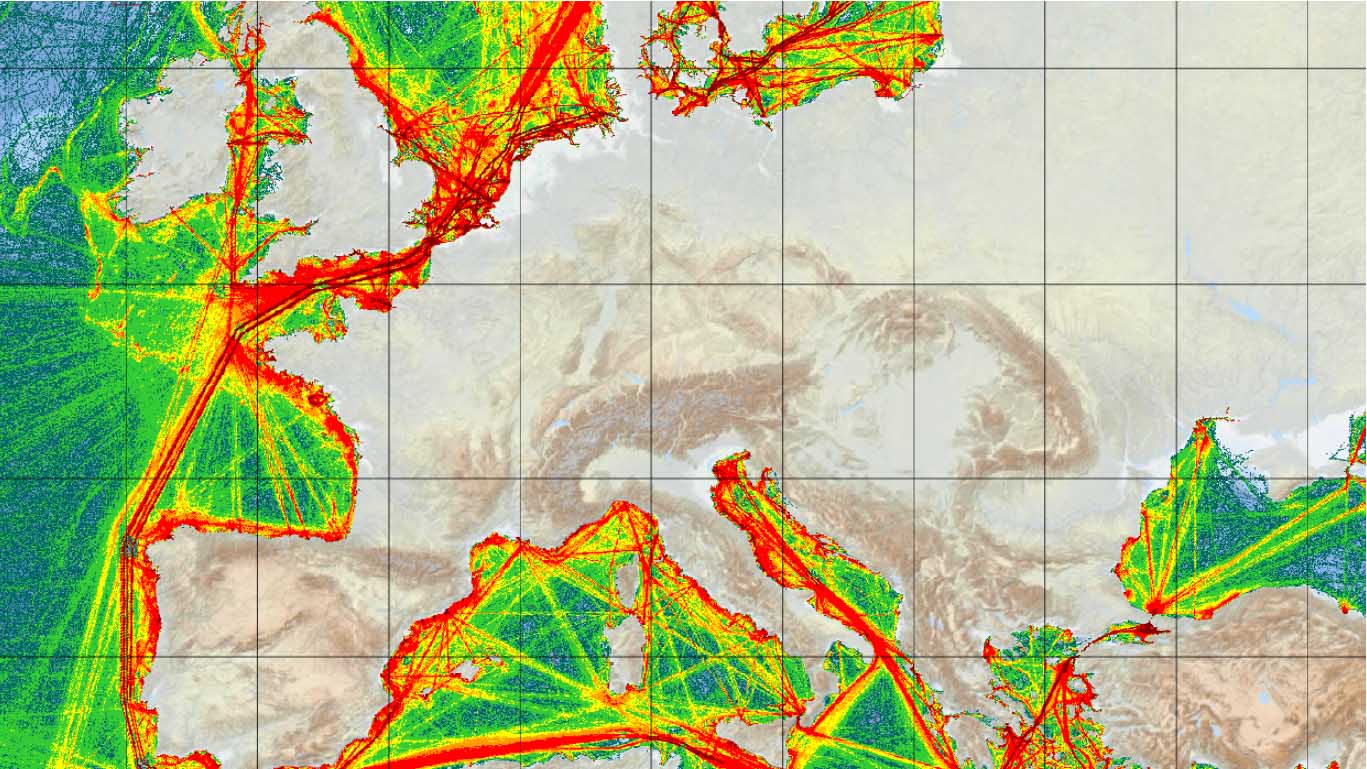
Developed under the interoperability project and part of EMSA’s Integrated Maritime Services (IMS), the traffic density mapping service computes ship position data and calculates the density of traffic per geographical cells of 1 x 1 km and per time periods (e.g., month, season, year) in the overall EU maritime area.
The service computes ship position data from several sources including Terrestrial and Satellite AIS. By consolidating information from multiple AIS sensors from Member State administrations and data providers, the service offers a broader view on shipping traffic than that available from the AIS networks of Member States.
The resulting traffic density maps are made available to EU maritime authorities through the SafeSeaNet Ecosystem Graphical Interface (SEG), and to the public through the EMODnet Human Activities portal.
The service calculates more than 600 maps per year
 Project funded by the European Union –
European Maritime and Fisheries Fund
Find out more about the interoperability project:

Find out more about our work
Related Publications - Interoperability